Benchmarks
All benchmarks are defined in src/benchmarks.zig.
Run all the benchmarks with the following command:
zig build benchmark -- all
Run a specific benchmark group: socket_utils, gossip, or sync.
zig build benchmark -- gossip_service
Expensive Benchmark
Some benchmarks are computationally expensive and are not included in the all group unless
the -e flag is used. For example:
zig build benchmark -- all -e
You can also force new state to be generated for the expensive operation benchmarks:
zig build benchmark -- all -e -f
Benchmark Results
To collect the benchmark results use the --metrics flag:
zig build -Doptimize=ReleaseSafe benchmark -- all --metrics
The results are written to a csv in results/, which includes the average stats and the raw runtimes.
Below is an example output:
Average Stats
benchmark, read_time_min, read_time_max, read_time_mean, read_time_variance, benchmark, write_time_min, write_time_max, write_time_mean, write_time_variance,
readWriteAccounts(100k accounts (1_slot - ram index - ram accounts)), 172156041, 158767959, 162868245, 15183799545214, 303852750, 286908417, 292925858, 39820330697776,
readWriteAccounts(100k accounts (1_slot - disk index - ram accounts)), 165480250, 156170500, 160821658, 7611019088428, 319935833, 286708833, 304248199, 113169780175088,
Raw Runtimes
readWriteAccounts(100k accounts (1_slot - ram index - ram accounts)) (read_time), 41451000, 40685750, 41123125, 40722417, 40743667
readWriteAccounts(100k accounts (1_slot - ram index - ram accounts)) (write_time), 81834042, 75340000, 76776125, 74969958, 74682792
Visualizing Benchmarks
Once metrics have been collected on two different runs, you can visualize the results using the view_bench.py script.
# NOTE: need to format doc to below
python scripts/view_bench.py results/BenchmarkAccountsDB/readWriteAccounts_runtimes.csv # view runtimes as a charts with one file source
python scripts/view_bench.py readWriteAccounts_runtimes.csv readWriteAccounts_runtimes_2.csv # compare runtimes against two *equivalent* files
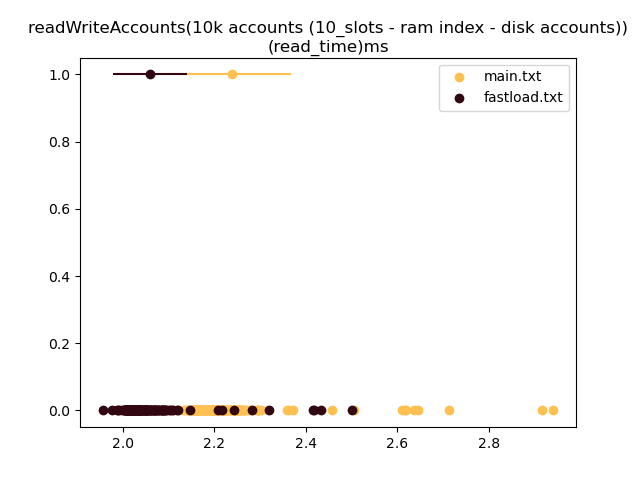
- each point on y-axis=0 is a runtime
- the point on y-axis=1 is the mean with the bar surrounding it being the standard deviation
Tracking Benchmarks Over Time
two main scripts are used to track benchmarks over time:
scripts/collect_benchmarks.shis periodically called using a cron job to run the benchmarks on new git commitsscripts/benchmark_server.pyis run as a server to visualize the results over time